6 Channel Vibration and Phase Analyzer
The best value in vibration analysis.


The Power of Phase
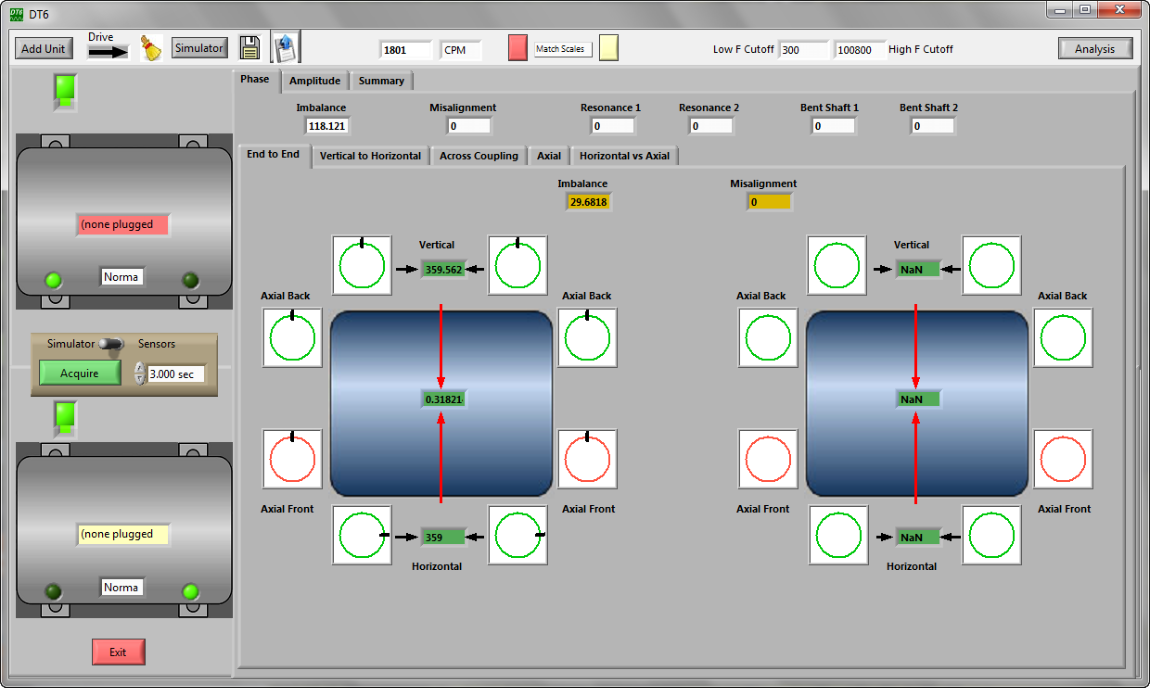
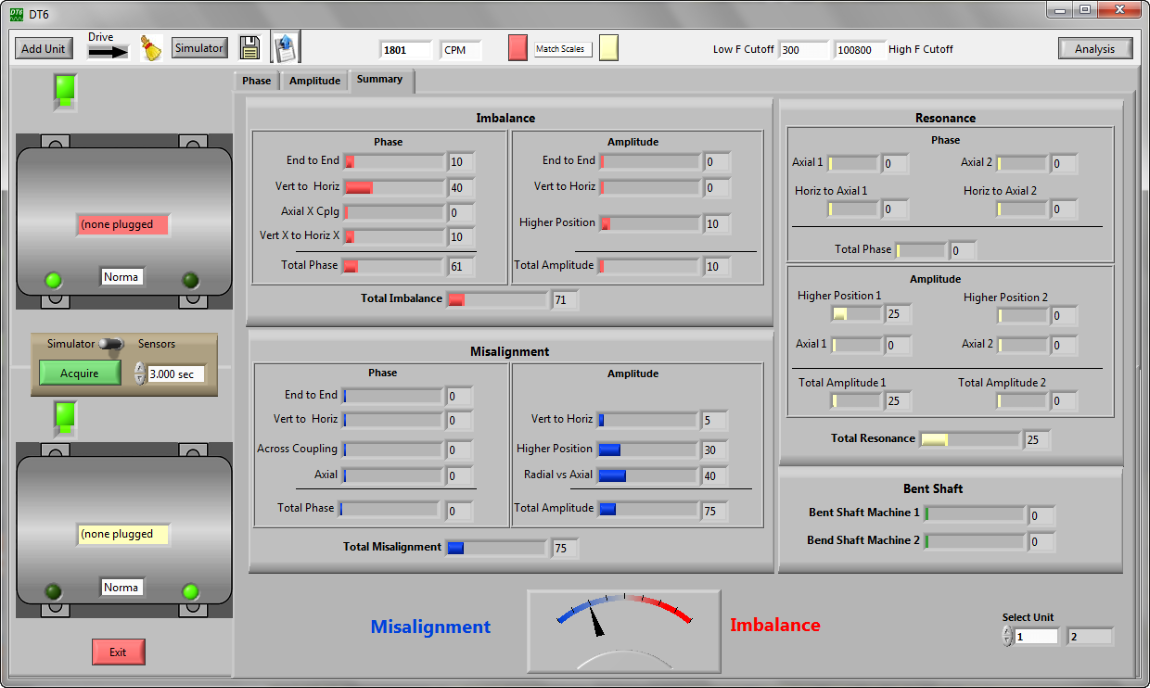
In today’s world, too often vibration analysts do their work by simply looking at the Frequency Domain and attempt to “pattern match” peaks in an FFT. This “wall chart” approach may work for many common vibration problems and, if all goes well, accurate calls on what is happening with the machinery and what to do about it can be made. However, in the real world, life is never so simple. The fact is that only certain things can be known by a look at the Frequency Domain and by definition, it only reveals part of the full picture. The fact is that knowing only part of the total picture will lead to limited understanding and, at times, a completely wrong and costly conclusion. The Frequency Domain represented by the FFT will only tell you the amount of energy or amplitude there is at different frequency ranges. While this is extremely useful, it cannot tell you what is occurring in Time. While the Time Domain plot can reveal what is happening over a period of time, it can sometimes be difficult to extract out exact information like particular frequencies. This is largely due to the fact that the Time plot is more confusing and complex because all frequencies, and their relative phases, influence the combined often “messy” looking single trace. The Time Domain can be very useful however, in revealing short duration events like bumps, knocking and often can show their “ring down” effects. Phase information, especially relative phase information, provides yet another perspective that is simply not readily available in the other two perspective views. Where the Frequency plot tells how much at what frequency and the Time plot tells how much over time, Phase tells when something is happening. Relative Phase tells what is happening at a given frequency relative to another point(s). Therefore relative phase will tell you the actual Motion of the machine, something not apparent in the other displays. While knowing how much amplitude there is at a specific frequency is very valuable, its causes could come from many different sources. Here is where knowing how a machine is moving can make all the difference in an accurate diagnosis. There are some types of motions that are classic forms of unbalance motion and others that simply cannot be accounted for by unbalance but strongly indicate misalignment. Seeing the patterns in an FFT tells part of the picture; knowing the relative phases and therefore how the machine is moving completes the picture. If Phase is so valuable, then why is it so rarely used, especially in “ordinary” analysis? The reason is that it is simply too much of a hassle to gather the information—if the ability to get phase is even part of the instrument in the first place! One common procedure is to attach a strobe light and manually mark a “balloon diagram” to indicate each readings phase mark. Another involves actually shutting down the machine and applying a reflective marker or tape so that when running again an optical pick up or laser can be used to gather the Phase data. Some of the newer instruments allow the user to determine relative phase between 2 accelerometers, but again, acquiring Phase on a complete machine train can be time consuming and difficult. DT6 changes all of this. By utilizing 2 triaxial accelerometers with a customized microprocessor, 6 channels of Phased synchronized data can be acquired with a single acquisition. To make the critical adjustments to create a meaningful set of Phases over several units, the intelligent Phase Adjustment module allows the user to collect several separate readings and the system will make the appropriate adjustments automatically. No more shutting down the machine and adding reflective markers, bringing additional sensors and painstakingly separately logging and adjusting to get a complete Phase picture! To make it even better, the sometime confusing Phase relationship rules (up/down, side/side, across coupling etc.) are encaposolated in a completely unique Analysis Support system that shows a progression of calculated point values of those rules to help with your diagnosis. It’s like having a 2nd opinion in your back pocket! This unique and powerful feature will help the analyst understand the complete picture and how that picture is created, leading to far more accurate calls. Saving the time and effort by balancing when it really needed aligning or vice versa will more than pay for the DT6. DT6 Overview Power of Phase Mechanics Helper Departmental Tool Small Plant System Professional Services